
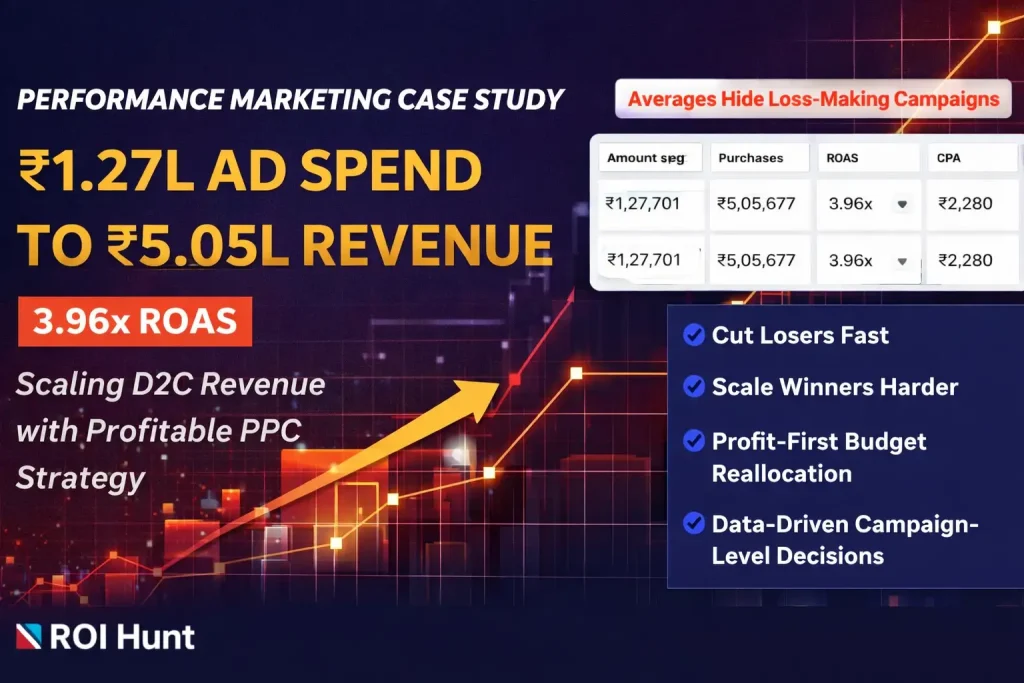
Performance Marketing Case Study: 1.27Lakh Ad Spend to 5.05Lakh Revenue (3.96x ROAS)
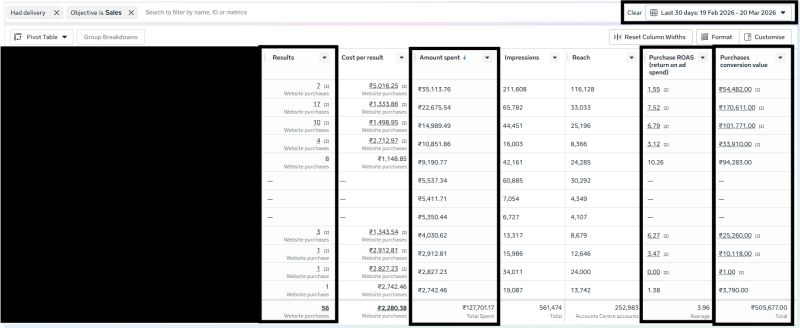
One campaign delivered 10.26x ROAS.
Another dropped to 1.38x.
One didn’t convert at all.
Same account.
Same funnel.
Same products.
So what changed?
This performance marketing case study by ROI Hunt, a results-driven PPC service provider, breaks down how ₹5,05,677 in revenue was generated from ₹1,27,701 in ad spend — while exposing why average ROAS is the most dangerous metric in scaling D2C brands.
The Objective
– Drive profitable website purchases using PPC campaigns
– Maintain stable ROAS across campaigns
– Identify high-performing campaigns quickly
– Reduce wasted ad spend
– Improve CPA efficiency without reducing scale
The Challenge
– Strong blended performance hiding inefficiencies
– Budget distributed across mixed-performing campaigns
– Some campaigns highly profitable, others loss-making
– No clear scaling framework
– Dependency on average ROAS for decisions
Performance ranged from:
– 10.26x ROAS (top performer)
– 0 ROAS (complete loss)
That’s not a platform issue.
That’s a decision-making issue.
The Strategy: Breakdown Over Averages
1. Revenue-First Optimization
Campaigns were optimized for:
– Website purchases
– Cost per acquisition (CPA)
– Revenue per ₹1 spent
– Break-even ROAS
We ignored blended ROAS.
Profitability was the only KPI.
2. Campaign-Level Segmentation
Instead of looking at account averages:
– Campaigns were classified as winners, stable, and losers
– High-performing campaigns isolated
– Loss-making campaigns identified instantly
This created clarity in decision-making.
3. Budget Reallocation Based on Performance
Budget was not distributed equally:
– High ROAS campaigns scaled
– Low ROAS campaigns reduced or paused
– Spend shifted toward proven converters
Scaling was controlled and data-backed.
4. Scaling the Outliers (Winners)
Top campaign (10.26x ROAS) was scaled using:
– Gradual budget increments
– Duplicate scaling strategy
– Audience expansion
We scaled what was already working — not what we hoped would work.
5. Loss Control Framework
Clear rules implemented:
– Campaigns below 1.5 ROAS paused
– CPA thresholds strictly monitored
– No emotional decision-making
This stopped silent budget leakage.
Results (Last 30 Days)
Performance Snapshot
– Total Ad Spend: ₹1,27,701
– Tracked Revenue: ₹5,05,677
– Website Purchases: 56
– Average ROAS: 3.96x
– Top Campaign ROAS: 10.26x
– Lowest Campaign ROAS: 0x
– Average CPA: ₹2,280
What This Means
– Every ₹1 generated ₹3.96 in revenue
– A single campaign drove disproportionate profit
– Weak campaigns diluted overall performance
– Scaling required precision, not averages
The difference between 0x and 10.26x wasn’t random.
It was visibility.
Why This Campaign Worked
Micro-Level Optimization
Decisions were made at campaign level, not account level
Budget Discipline
Money followed performance, not assumptions
Clear Scaling Framework
Winners scaled. Losers cut fast
Data-Led Execution
Every move backed by performance data
Profit-First Approach
ROAS and CPA controlled every decision
Conclusion
Most brands don’t lose money on ads.
They lose money on averages.
One campaign was printing profit.
Another was draining budget.
The account looked healthy.
The system wasn’t.
Performance marketing isn’t about managing campaigns.
It’s about managing outliers.
👉 Cut losers fast
👉 Scale winners harder
That’s how PPC becomes a predictable growth engine.