
Meta Ads Case Study: 73K Ad Spend to 5.30Lakh Revenue in 30 Days (7.00x ROAS)
One ad made ₹1.14L from just ₹8.2K.
Another barely survived at 0.79x ROAS.
Same product.
Same funnel.
Same account.
So what changed?
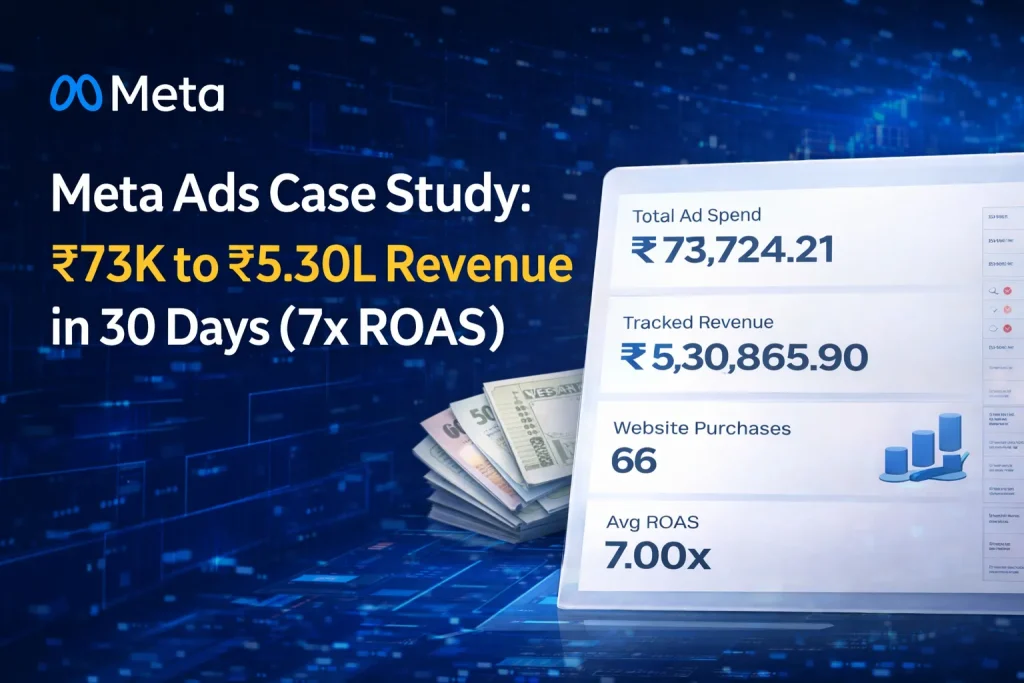
This Meta Ads case study by ROI Hunt, a results-driven Facebook marketing company, breaks down how structured testing, angle optimization, and disciplined scaling generated ₹5,30,865.90 in revenue from ₹73,724.21 in ad spend — while exposing the real driver of D2C profitability.
The Objective
- – Drive profitable website purchases using Meta Ads
- – Maintain strong ROAS across cold + retargeting
- – Identify scalable ad sets quickly
- – Reduce inefficient budget burn
- – Improve CPA without killing volume
The Challenge
- – Multi-ad-set structure with performance gaps
- – Budget constraint (~₹73K total spend)
- – Some ad sets are highly profitable, others are draining capital
- – Need to scale winners without breaking algorithm stability
- – Maintain profitability while testing aggressively
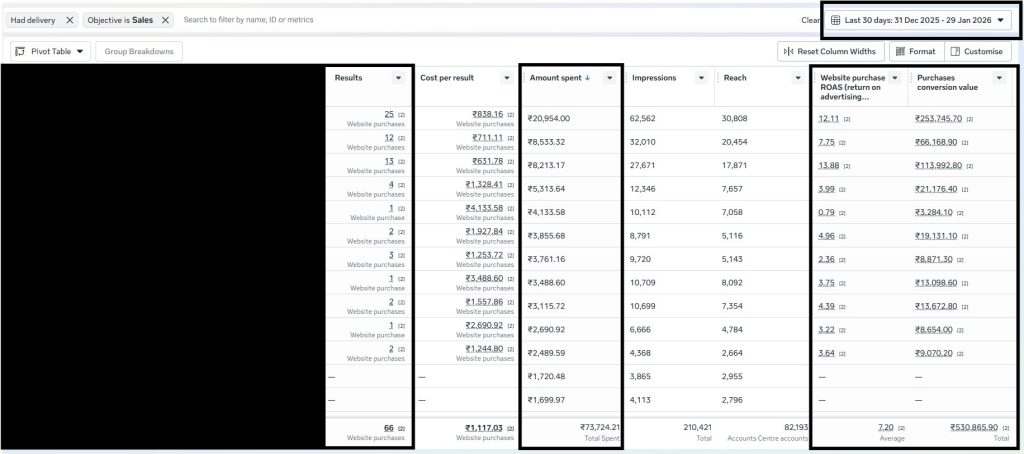
Performance varied from:
- – 13.88x ROAS (top performer)
- – 0.79x ROAS (underperformer)
That’s not a targeting issue.
That’s a positioning issue.
The Strategy: Structured Testing Over Random Scaling
1. Revenue-First Optimization
Campaigns were optimized for:
- – Website purchases
- – Cost per acquisition (CPA) stability
- – Revenue per ₹1 spent
- – Break-even ROAS alignment
We ignored vanity metrics like CTR.
Revenue was the north star.
2. Creative Angle Testing Framework
The biggest shift came from angle testing.
We tested:
- – Problem-focused hooks
- – Offer-led creatives
- – Urgency-driven messaging
- – Social proof variants
Same product.
Different framing.
The 13.88x ROAS ad wasn’t “better designed.”
It communicated value sharper.
3. Budget Reallocation Based on Efficiency
Instead of equal budget distribution:
- – High ROAS clusters received increased funding
- – Sub-1x performers were capped or paused
- – Scaling was gradual (20–30% increments)
- – CPA trend stability monitored daily
We scaled what was mathematically safe.
4. Funnel Stage Mapping (Cold + Retargeting Sync)
Cold traffic:
- – Filtered high-intent users
- – Tested broad interest pools
Retargeting:
- – Captured engaged users
- – Reinforced offer clarity
- – Reduced CPA volatility
This created a structured acquisition loop — not isolated campaigns.
5. Unit Economics Control
Key financial guardrails:
- – Avg CPA: ₹1,117.03
- – Avg ROAS: 7.00x
- – Purchase Volume: 66
Every scaling decision aligned with:
AOV × Conversion Rate × CAC
If these numbers didn’t align, scaling stopped.
Results (Last 30 Days)
Performance Snapshot
- – Total Ad Spend: ₹73,724.21
- – Tracked Revenue: ₹5,30,865.90
- – Website Purchases: 66
- – Average ROAS: 7.00x
- – Top Ad Set ROAS: 13.88x
- – Lowest Ad Set ROAS: 0.79x
- – Average CPA: ₹1,117.03
What This Means
- – Every ₹1 generated ₹7 in revenue
- – Creative angle directly impacted profitability
- – Testing speed determined margin stability
- – Controlled scaling protected overall account ROAS
The gap between 0.79x and 13.88x wasn’t luck.
It was clarity.
Why This Campaign Worked
Ruthless Creative Testing
Angles were tested before scaling budgets.
Financial Discipline
ROAS and CPA dictated budget flow.
Structured Funnel Strategy
Cold + retargeting worked as one revenue engine.
Speed of Iteration
Winning ads were identified and scaled quickly.
Business-Level Thinking
Ads were treated as profit multipliers — not traffic drivers.
Conclusion
D2C isn’t won by who spends more.
It’s won by who tests faster than they burn budget.
One ad made ₹1.14L from ₹8.2K.
Another lost momentum at 0.79x.
The difference?
Angle.
Offer.
Timing.
Meta Ads don’t scale businesses.
Math does.